
Some time ago, I needed to monitor Remote Desktop Gateway (RDG) authentication and authorization using Windows Event Logs and Splunk. I initially expected this task to be straightforward – similar to monitoring VPN activity on a firewall. Unfortunately, that wasn’t the case.
The main challenge I faced was correlating different logs related to connections, authentication, and authorization.
Starting Point: Event ID 312
Let’s begin at the start. I found very useful information in the Microsoft-Windows-TerminalServices-Gateway/Operational log, specifically Event ID 312:
The user “username@DOMAINNAME”, on client computer “12.12.12.12:2827”, has initiated an outbound connection. This connection may not be authenticated yet.
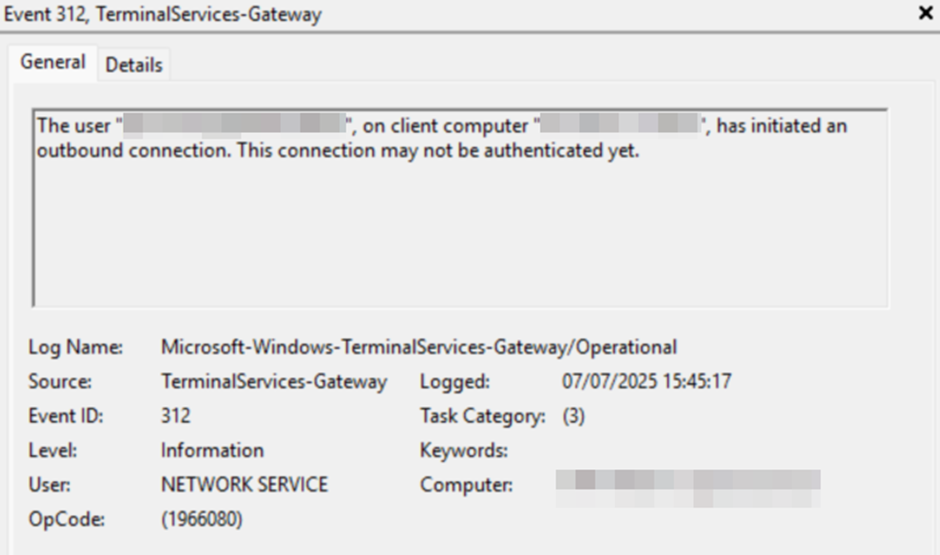
This tells us that a connection was initialized and provides both the username and the client’s source IP address.
The Authentication Challenge
The next step is authentication. This is where the problems began.
If the domain name (DOMAINNAME) is valid, authentication is forwarded to a Domain Controller, and logs must be correlated accordingly. You could use Event ID 4768, where:
- Result Code: 0x0 indicates success.
- Any other code indicates failure.
However, correlating Event ID 4768 with Event ID 312 would require matching on the username, client IP address, and timestamp – a complex task, especially when dealing with logs from both RD Gateway and Domain Controllers.
To complicate things further, if the domain or username is invalid (e.g., due to a brute-force or dictionary attack), the authentication attempt does not reach the Domain Controller. Instead, it’s logged in the RD Gateway logs using Event ID 4625.
Simplifying the Process with Event ID 302
After analyzing the complexities, I decided to take a simpler and more effective approach – by incorporating Event ID 302 into the query:
The user “DOMAINNAME\username”, on client computer “12.12.12.12”, connected to resource “-SERVER-RDSHOST”. Connection protocol used: “HTTP”.
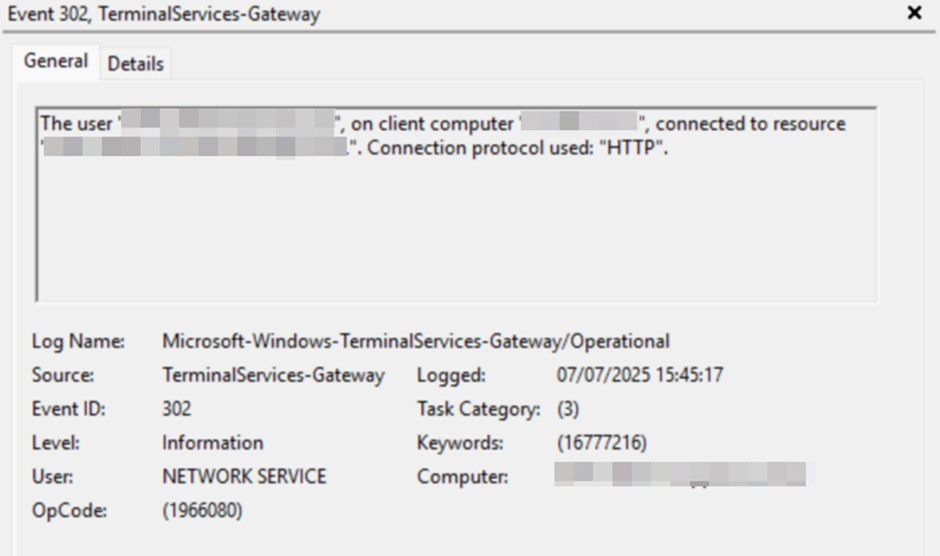
This log entry confirms that both authentication and authorization were successful, and it shows where the connection was forwarded – providing sufficient information to record the result.
Logical Flow
The log flow is as follows:
- Connection Initiated – Logged by Event ID 312.
- Two possible outcomes:
- SUCCESS – If Event ID 312 is followed by Event ID 302 for the same username and IP address within a 1-second window.
- FAILURE – If Event ID 302 does not follow within that window.
Building the Splunk Search Query
Here’s how I approached the Splunk query, solving several key problems along the way.
1. Filter Relevant Events
index="event_log" host IN (RDG-01, RDG-02, RDG-N) EventID IN (312, 302)2. Normalize Username Format
Event ID 312 logs the username as username@DOMAINNAME, while Event ID 302 uses DOMAINNAME\username. To correlate these, we normalize the username:
| eval NormalizedUser=lower(Username)
| rex mode=sed field=NormalizedUser "s/^[^\\\\]*\\\\//"
| rex mode=sed field=NormalizedUser "s/@.*$//"
3. Normalize IP Address
Event ID 312 includes the port (e.g., 12.12.12.12:2827), so we remove it:
| rex mode=sed field=IpAddress "s/:.*//"4. Handle Timestamps and Time Zones
The next problem was with time. By default, event logs record timestamps with 1-second accuracy, which unfortunately wasn’t sufficient for the query.

I decided to use SystemTime, but that introduced another issue, as it operates in the UTC time zone. In my case, this resulted in a one-hour discrepancy.
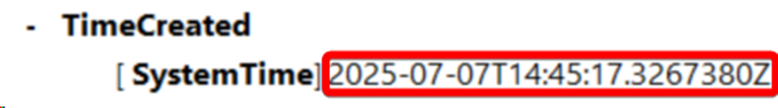
I addressed both problems in the query below. It was quite challenging – especially accounting for time zone adjustments and daylight saving time.
| eval _time=strptime(SystemTime,"%Y-%m-%dT%H:%M:%S.%5N")
| eval _time=relative_time(_time,strftime(_time,"%:::z")."h")
| sort _time
5. Group Logs Within 1-Second Window
Using streamstats, we group logs by time, username, and IP address:
| streamstats time_window=1s values(_time) as Time values(Computer) as Computer_name values(EventID) as Event count(eval(EventID)) as EventCount values(Resource) as Destination last(eval(if(EventID=312,_time,null()))) as previous_time by NormalizedUser IpAddress6. Remove Duplicate Groups
When status is SUCCESS: multiple 312 logs may fall into the same time window. We deduplicate them:
splCopyEdit| dedup previous_time NormalizedUser IpAddress sortby EventCount desc
7. Determine Connection Status
Based on the count of correlated events:
| eval status = if(EventCount > 1,"SUCCESS","FAILURE")
8. Format Time for Readability
Another necessary step was converting epoch time to a human readable format.
| eval c_time=strftime(Time,"%Y-%m-%dT%H:%M:%S.%5N")
9. Display the Final Table
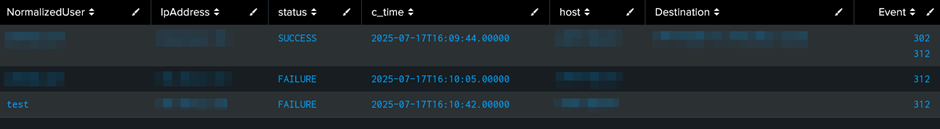
And finally, displaying the results in a table format, sorted by time.
| table NormalizedUser IpAddress status c_time host Destination Event
| sort c_time
Complete Query
index="event_log" host IN (RDG-01, RDG-02, RDG-N) EventID IN (312, 302)
| eval NormalizedUser=lower(Username)
| rex mode=sed field=NormalizedUser "s/^[^\\\\]*\\\\//"
| rex mode=sed field=NormalizedUser "s/@.*$//"
| rex mode=sed field=IpAddress "s/:.*//"
| eval _time=strptime(SystemTime,"%Y-%m-%dT%H:%M:%S.%5N")
| eval _time=relative_time(_time,strftime(_time,"%:::z")."h")
| sort _time
| streamstats time_window=1s values(_time) as Time values(Computer) as Computer_name values(EventID) as Event count(eval(EventID)) as EventCount values(Resource) as Destination last(eval(if(EventID=312,_time,null()))) as previous_time by NormalizedUser IpAddress
| dedup previous_time NormalizedUser IpAddress sortby EventCount desc
| eval status = if(EventCount > 1,"SUCCESS","FAILURE")
| eval c_time=strftime(Time,"%Y-%m-%dT%H:%M:%S.%5N")
| table NormalizedUser IpAddress status c_time host Destination Event
| sort c_time
Sample Output
Acknowledgments
Special thanks to @malix_la_harpe from the Splunk community for helping me discover the streamstats approach, which proved to be an elegant solution to a complex correlation problem.